MindCompass
Results people can actually read.
An AI psychometric testing platform, designed from research to high-fidelity prototype. My focus included turning results into something lay readers could understand.
- Role
- Senior UX/UI Designer (contract)
- Timeline
- January - July 2023
- Scope
- UX research, product design, results visualization
- Status
- Psychometric testing platform
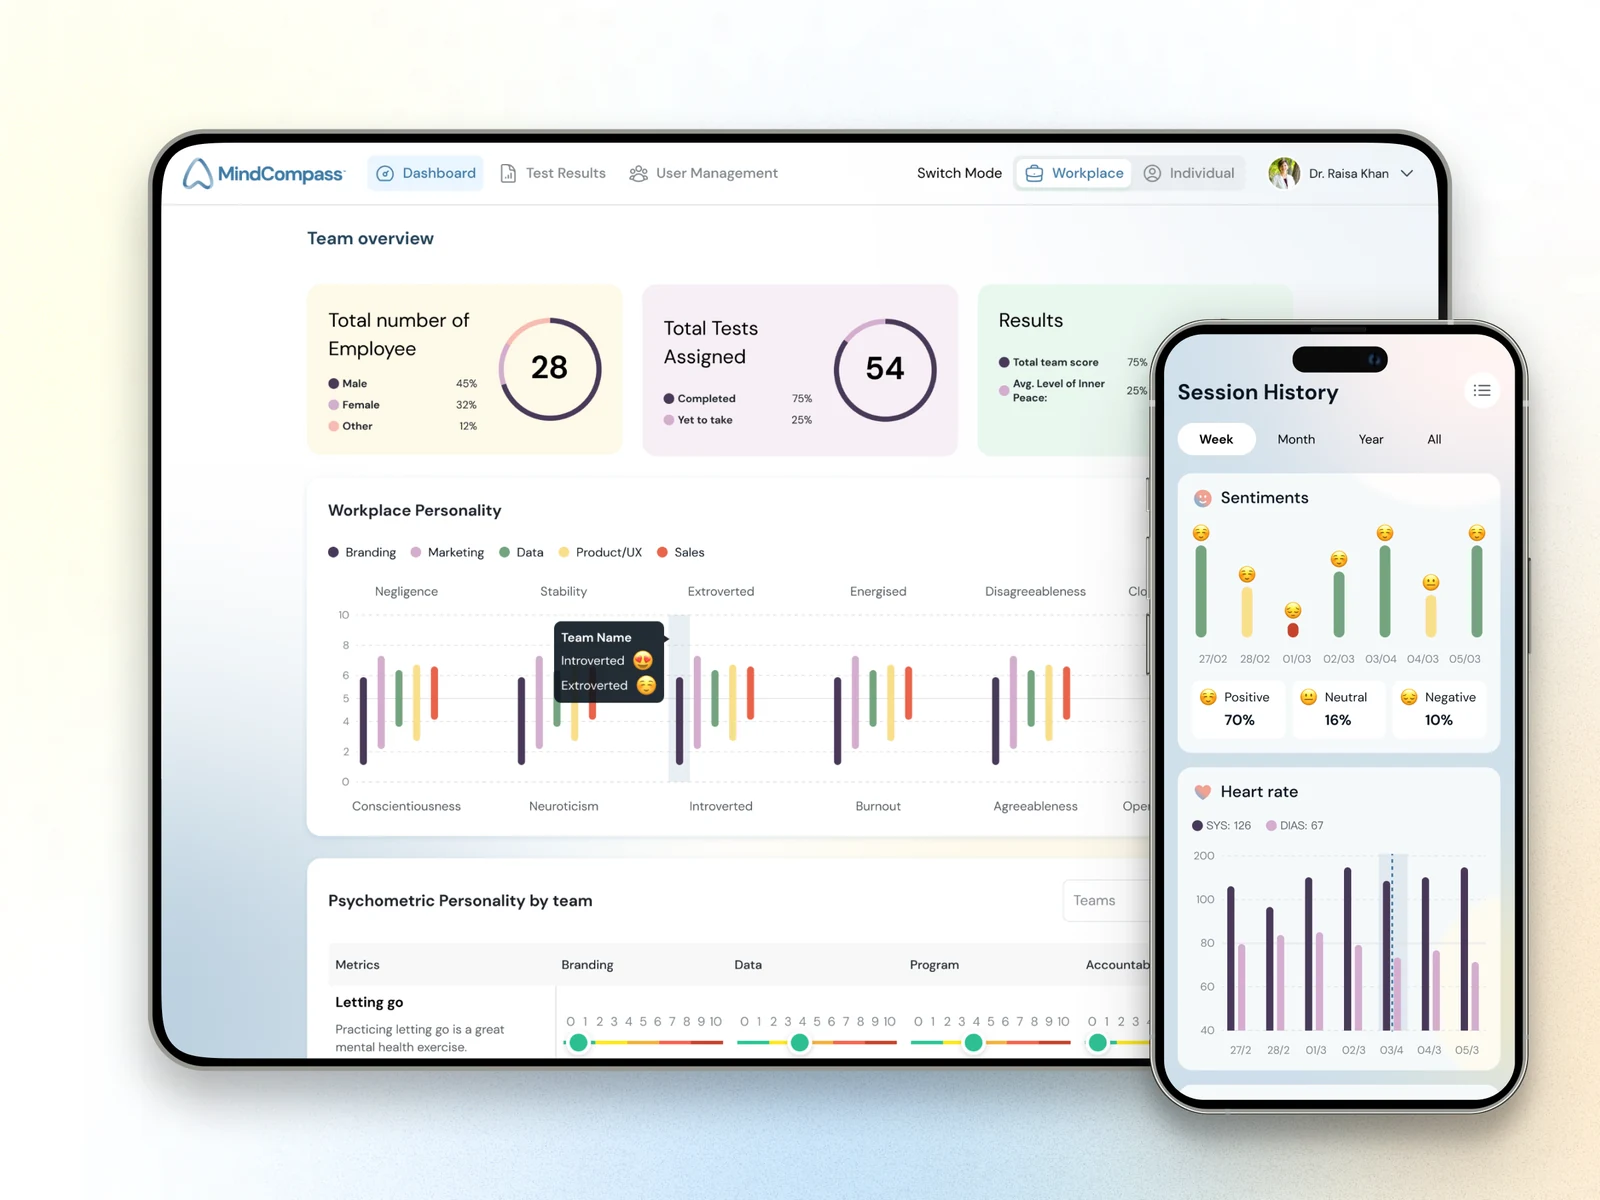
The problem
The person taking an assessment, a clinician and an organization need different views of the same information. The interface had to make results understandable without collapsing those distinctions.
My part
I owned research and interface design, including the visualization of results. I worked through both the assessment experience and the views used to interpret it.
Key decisions
Design for different readers
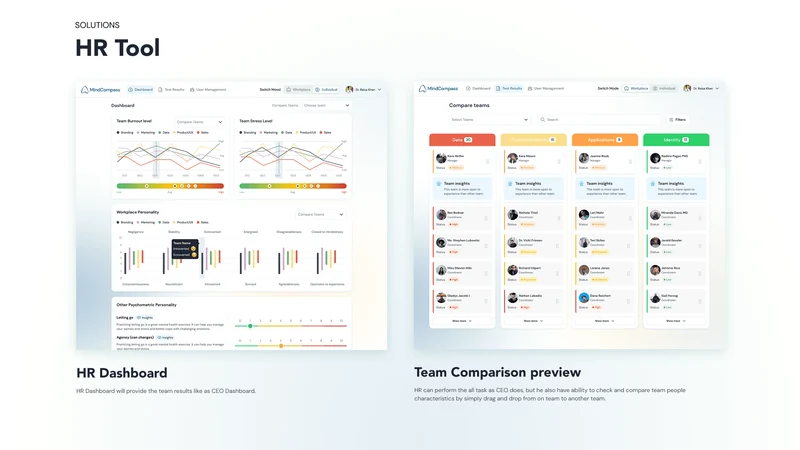
The same dataset needs different framing for a clinician, an HR lead, an executive and the individual. The boundaries between those views are part of the design.
Keep a score attached to its meaning
Results place the scale and population next to the value, giving the reader context rather than an isolated number.
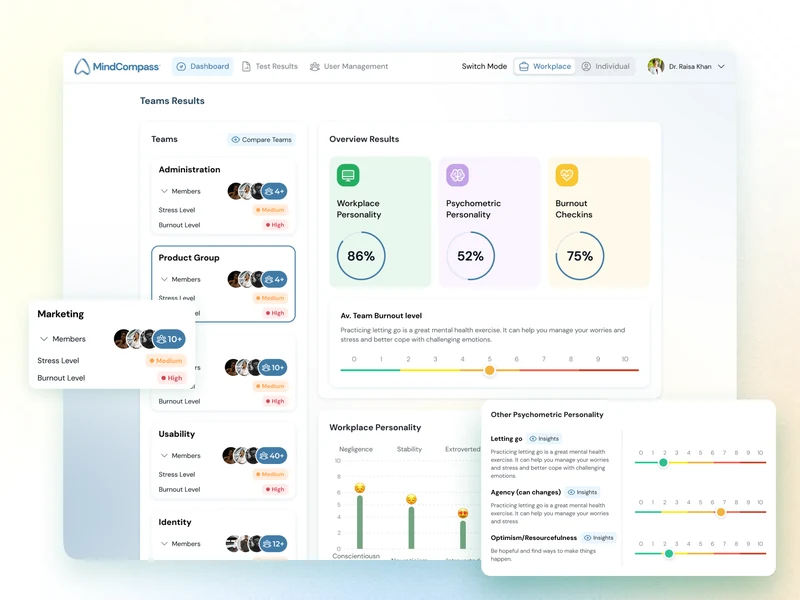
Compare teams without exposing individuals
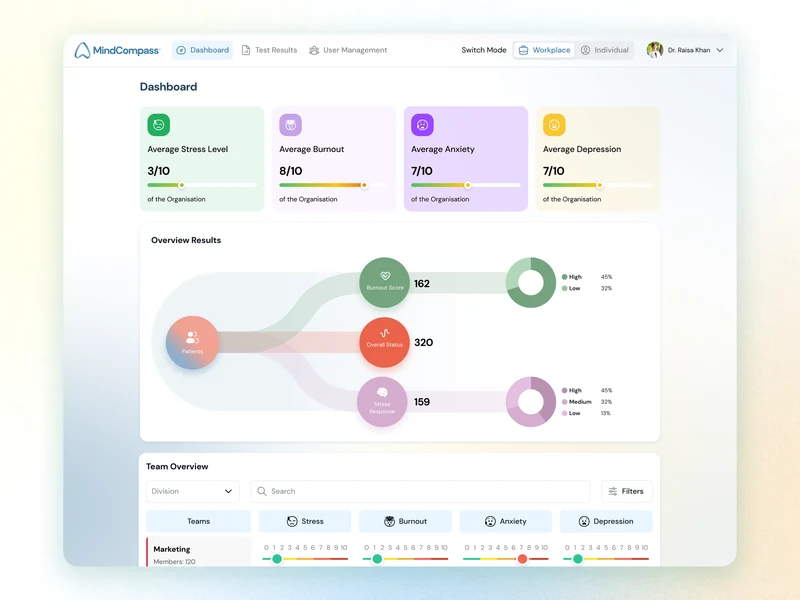
Group views support comparisons across departments while keeping individual results out of those comparisons.
Give people their own report
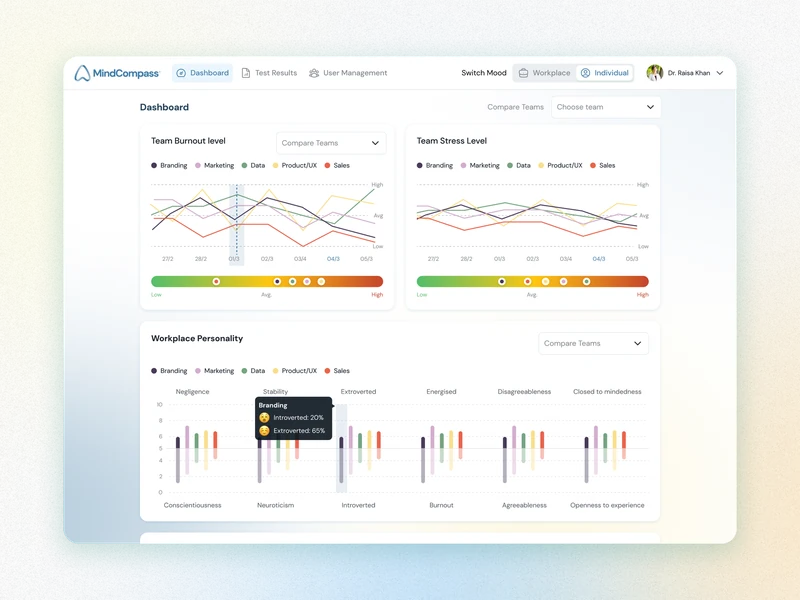
The personal report is framed for the person it describes, making a complex set of results easier to understand.
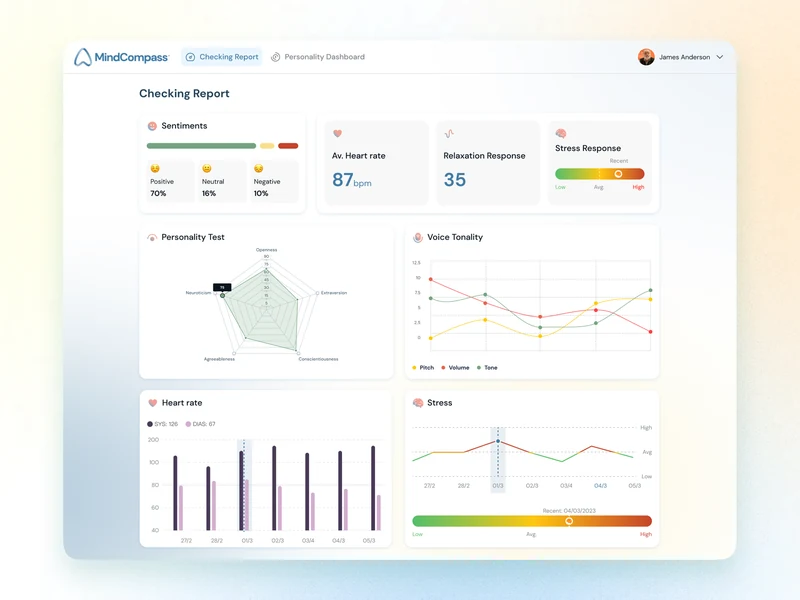
One more reader.
Team-level results for the people running the organization.
Where it landed
A high-fidelity platform prototype with reader-specific dashboards and understandable results visualization.
See the original write-up